8 Reliability
Chapter 8 of the Dynamic Learning Maps® (DLM®) Alternate Assessment System 2014–2015 Technical Manual—Year-End Model (Dynamic Learning Maps Consortium, 2016) describes the methods used to calculate reliability for the DLM assessment system and provides results at six levels, consistent with the levels of reporting. The 2015–2016 Technical Manual Update—Year-End Model (Dynamic Learning Maps Consortium, 2017a) expands the description of the methods used to calculate reliability and provides results at six reporting levels. This chapter provides a high-level summary of the methods used to calculate reliability, along with updated evidence from the 2020–2021 administration year for six levels. This chapter provides a high-level summary of the methods used to calculate reliability, along with updated evidence from the 2020–2021 administration year for six levels.
For a complete description of the simulation-based methods used to calculate reliability for DLM assessments, including the psychometric background, see the 2015–2016 Technical Manual Update—Year-End Model (Dynamic Learning Maps Consortium, 2017a).
8.1 Background Information on Reliability Methods
The reliability information presented in this chapter adheres to guidance given in the Standards for Educational and Psychological Testing (American Educational Research Association et al., 2014). Simulation studies were conducted to assemble reliability evidence according to the Standards’ assertion that “the general notion of reliability/precision is defined in terms of consistency over replications of the testing procedure” (American Educational Research Association et al., 2014, p. 35). The DLM reliability evidence reported here supports “interpretation for each intended score use,” as Standard 2.0 dictates (American Educational Research Association et al., 2014, p. 42). The “appropriate evidence of reliability/precision” (American Educational Research Association et al., 2014, p. 42) was assembled using a nontraditional methodology that aligns with the design of the assessment and interpretations of results.
Consistent with the levels at which DLM results are reported, this chapter provides results for six types of reliability evidence. For more information on DLM reporting, see Chapter 7 of the 2014–2015 Technical Manual—Year-End Model (Dynamic Learning Maps Consortium, 2016). The types of reliability evidence for DLM assessments include (a) classification to overall performance level (performance level reliability); (b) the total number of linkage levels mastered within a subject (subject reliability); (c) the number of linkage levels mastered within each conceptual area for ELA and mathematics (conceptual area reliability); (d) the number of linkage levels mastered within each Essential Element (EE; EE reliability); (e) the classification accuracy of each linkage level within each EE (linkage level reliability); and (f) classification accuracy summarized for the five linkage levels (conditional evidence by linkage level). As described in the next section, reliability evidence comes from simulation studies in which model-specific test data are generated for students with known levels of attribute mastery.
8.2 Methods of Obtaining Reliability Evidence
Standard 2.1: “The range of replications over which reliability/precision is being evaluated should be clearly stated, along with a rationale for the choice of this definition, given the testing situation” (American Educational Research Association et al., 2014, p. 42).
The simulation used to estimate reliability for DLM versions of scores and classifications considers the unique design and administration of DLM assessments. The use of simulation is necessitated by two factors: the assessment blueprint and the results that classification-based administrations give. Because of the limited number of items students complete to cover the blueprint, students take only minimal items per EE. The reliability simulation replicates DLM classification-based scores from real examinees based upon the actual set of items each examinee took. Therefore, this simulation replicates the administered items for the examinees. Because the simulation is based on a replication of the same items administered to examinees, the two administrations are perfectly parallel.
8.2.1 Reliability Sampling Procedure
The simulation design that was used to obtain the reliability estimates developed a resampling design to mirror the trends existing in the DLM assessment data. In accordance with Standard 2.1, the sampling design used the entire set of operational assessment data to generate simulated examinees. Using this process guarantees that the simulation takes on characteristics of the DLM operational assessment data that are likely to affect reliability results. For one simulated examinee, the process was as follows:
- Draw with replacement the student record of one student from the operational assessment data (i.e., spring window). Use the student’s originally scored pattern of linkage level mastery and non-mastery as the true values for the simulated student data.
- Simulate a new set of item responses to the set of items administered to the student in the operational testlet. Item responses are simulated from calibrated model parameters Calibrated-model parameters were treated as true and fixed values for the simulation. for the items of the testlet, conditional on the profile of linkage level mastery or non-mastery for the student.
- Score the simulated item responses using the operational DLM scoring procedure, estimating linkage level mastery or non-mastery for the simulated student. See Chapter 5 of the 2015–2016 Technical Manual Update—Year-End Model (Dynamic Learning Maps Consortium, 2017a) for more information. All three scoring rules were included when scoring the simulated responses to be consistent with the operational scoring procedure. The scoring rules are described further in Chapter 5 of this manual.
- Compare the estimated linkage level mastery or non-mastery to the known values from Step 2 for all linkage levels at which the student was administered items.
Steps 1 through 4 are then repeated 2,000,000 times to create the full simulated data set. Figure 8.1 shows the steps of the simulation process as a flow chart.
Figure 8.1: Simulation Process for Creating Reliability Evidence
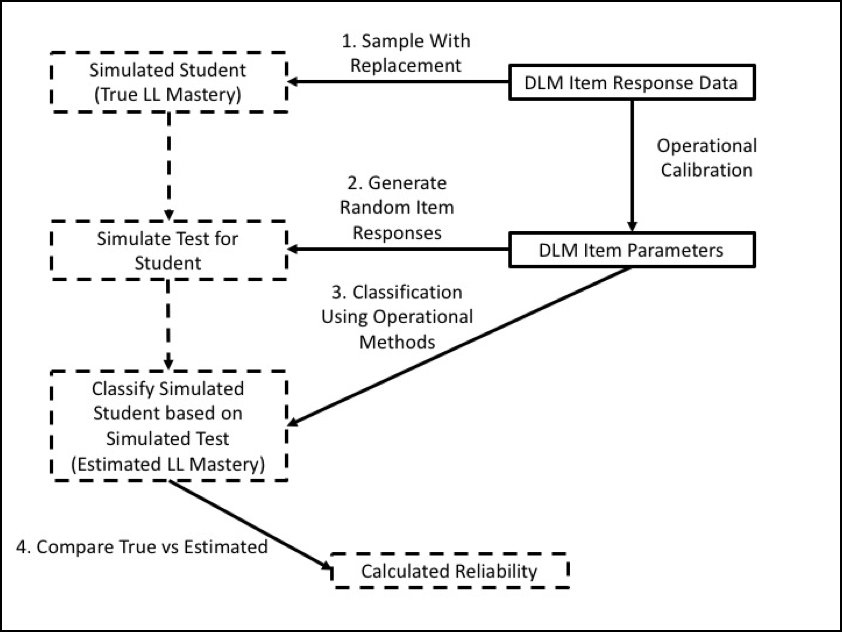
Note. LL = linkage level
8.3 Reliability Evidence
Standard 2.2: “The evidence provided for the reliability/precision of the scores should be consistent with the domain of replications associated with the testing procedures, and with the intended interpretations for use of the test scores” (American Educational Research Association et al., 2014, p. 42).
Standard 2.5: “Reliability estimation procedures should be consistent with the structure of the test” (American Educational Research Association et al., 2014, p. 43).
Standard 2.12: “If a test is proposed for use in several grades or over a range of ages, and if separate norms are provided for each grade or each age range, reliability/precision data should be provided for each age or grade-level subgroup, not just for all grades or ages combined” (American Educational Research Association et al., 2014, p. 45).
Standard 2.16: “When a test or combination of measures is used to make classification decisions, estimates should be provided of the percentage of test takers who would be classified in the same way on two [or more] replications of the procedure” (American Educational Research Association et al., 2014, p. 46).
Standard 2.19: “Each method of quantifying the reliability/precision of scores should be described clearly and expressed in terms of statistics appropriate to the method” (American Educational Research Association et al., 2014, p. 47).
This chapter provides reliability evidence for six levels of data: (a) performance level reliability, (b) subject reliability, (c) conceptual area reliability, (d) EE reliability, (e) linkage level reliability, and (f) conditional reliability by linkage level, which ensures that the simulation and resulting reliability evidence are aligned with Standard 2.2. Additionally, providing reliability evidence for each of the six levels ensures that these reliability estimation procedures meet Standard 2.5.
8.3.1 Performance Level Reliability Evidence
The DLM Consortium reports results using four performance levels. The scoring procedure sums the linkage levels mastered across all EEs in each subject, and cut points are applied to distinguish between performance categories.
Performance level reliability provides evidence for how reliably students are classified into the four performance levels for each subject and grade level. Because performance level is determined by the total number of linkage levels mastered, large fluctuations in the number of linkage levels mastered, or fluctuation around the cut points, could affect how reliably students are assigned into performance categories. The performance level reliability evidence is based on the true and estimated performance levels (i.e., based on the estimated total number of linkage levels mastered and predetermined cut points) for a given subject. Three statistics are included to provide a comprehensive summary of results; the specific metrics were chosen because of their interpretability:
- the polychoric correlation between the true and estimated performance levels within a grade and subject,
- the classification agreement rate between the true and estimated performance levels within a grade and subject, and
- the classification agreement Cohen’s kappa between the true and estimated performance levels within a grade and subject.
Table 8.1 presents this information across all grades and subjects. Polychoric correlations between true and estimated performance level range from .965 to .995. Classification agreement rates range from .876 to .925 and Cohen’s kappa values are between .902 and .969. These results indicate that the DLM scoring procedure of assigning and reporting performance levels based on total linkage levels mastered results in reliable classification of students into performance level categories.
| Grade | Polychoric correlation | Classification agreement rate | Cohen’s kappa |
|---|---|---|---|
| English language arts | |||
| 3 | .975 | .924 | .956 |
| 4 | .983 | .925 | .950 |
| 5 | .985 | .923 | .961 |
| 6 | .991 | .899 | .949 |
| 7 | .986 | .883 | .932 |
| 8 | .965 | .924 | .942 |
| 9 | .985 | .888 | .927 |
| 10 | .967 | .919 | .929 |
| 11 | .981 | .889 | .928 |
| 12 | .978 | .897 | .931 |
| Mathematics | |||
| 3 | .992 | .901 | .950 |
| 4 | .995 | .909 | .969 |
| 5 | .993 | .903 | .955 |
| 6 | .988 | .888 | .942 |
| 7 | .991 | .912 | .945 |
| 8 | .982 | .890 | .902 |
| 9 | .974 | .912 | .949 |
| 10 | .988 | .921 | .929 |
| 11 | .979 | .876 | .920 |
| 12 | .978 | .889 | .925 |
8.3.2 Subject Reliability Evidence
Subject reliability provides consistency evidence for the number of linkage levels mastered across all EEs for a given grade level and subject. Because students are assessed on multiple linkage levels across the assessed EEs in each subject, subject reliability evidence is similar to reliability evidence for testing programs that use summative assessments to describe subject performance. That is, the number of linkage levels mastered within a subject is analogous to the number of items answered correctly (i.e., total score) in a different type of testing program.
Subject reliability evidence compares the true and estimated number of linkage levels mastered across all tested levels for a given subject. Reliability is reported with three summary values:
- the Pearson correlation between the true and estimated number of linkage levels mastered within a subject,
- the classification agreement rate for which linkage levels were mastered, as averaged across all simulated students, and
- the classification agreement Cohen’s kappa for which linkage levels were mastered, as averaged across all simulated students.
Table 8.2 shows the three summary values for each grade and subject. Classification rate information is provided in accordance with Standard 2.16. The two summary statistics included in Table 8.2 also meet Standard 2.19. The correlation between true and estimated number of linkage levels mastered ranges from .974 to .990. Students’ average classification agreement rates range from .974 to .993 and average Cohen’s kappa values range from .934 to .988. These values indicate the DLM scoring procedure of reporting the number of linkage levels mastered provides reliable results of total linkage levels mastered.
| Grade | Linkage levels mastered correlation | Average student classification agreement | Average student Cohen’s kappa |
|---|---|---|---|
| English language arts | |||
| 3 | .989 | .981 | .952 |
| 4 | .990 | .983 | .960 |
| 5 | .990 | .980 | .949 |
| 6 | .989 | .982 | .958 |
| 7 | .986 | .974 | .934 |
| 8 | .988 | .976 | .938 |
| 9 | .988 | .976 | .941 |
| 10 | .986 | .976 | .944 |
| 11 | .988 | .974 | .935 |
| 12 | .988 | .976 | .942 |
| Mathematics | |||
| 3 | .985 | .990 | .978 |
| 4 | .988 | .987 | .970 |
| 5 | .983 | .987 | .973 |
| 6 | .983 | .991 | .982 |
| 7 | .982 | .990 | .980 |
| 8 | .982 | .991 | .983 |
| 9 | .982 | .989 | .979 |
| 10 | .979 | .991 | .982 |
| 11 | .974 | .992 | .986 |
| 12 | .974 | .993 | .988 |
8.3.3 Conceptual Area Reliability Evidence
Within each subject, students are assessed on multiple content strands. These strands of related EEs describe the overarching sections of the learning map model that is the foundation of the development of DLM assessments. For more information, see Chapter 2 of the 2014–2015 Technical Manual—Year-End Model (Dynamic Learning Maps Consortium, 2016). The strands used for reporting are the conceptual area in ELA and mathematics. Because Individual Student Score Reports summarize the number and percentage of linkage levels students mastered in each conceptual area (see Chapter 7 of this manual for more information), reliability evidence is also provided for each conceptual area.
Conceptual area reliability provides consistency evidence for the number of linkage levels mastered across all EEs in each conceptual area for each grade and subject. Because conceptual area reporting summarizes the total number of linkage levels a student mastered, the statistics reported for conceptual area reliability are the same as those reported for subject reliability.
Conceptual area reliability evidence compares the true and estimated number of linkage levels mastered across all tested levels for each conceptual area. Reliability is reported with three summary numbers:
- the Pearson correlation between the true and estimated number of linkage levels mastered within a conceptual area,
- the classification agreement rate for which linkage levels were mastered as averaged across all simulated students for each conceptual area, and
- the classification agreement Cohen’s kappa for which linkage levels were mastered as averaged across all simulated students for each conceptual area.
Table 8.3 shows the three summary values for conceptual area. Values range from .719 to .999 in ELA and from .639 to .999 in mathematics, indicating that, overall, the DLM method of reporting the total and percentage of linkage levels mastered by conceptual area results in values that can be reliably reproduced.
8.3.4 EE Reliability Evidence
Moving from higher-level aggregation to EEs, the reliability evidence shifts slightly. That is, because EEs are collections of linkage levels with an implied order, EE-level results are reported as the highest linkage level mastered per EE. Considering subject scores as total scores from an entire test, evidence at the EE level is finer grained than reporting at a subject strand level, which is commonly reported by other testing programs. EEs are specific standards within the subject itself.
Three statistics are used to summarize reliability evidence for EEs:
- the polychoric correlation between true and estimated numbers of linkage levels mastered within an EE,
- the classification agreement rate for the number of linkage levels mastered within an EE, and
- the classification agreement Cohen’s kappa for the number of linkage levels mastered within an EE.
Results are given in both tabular and graphical forms. Table 8.4 and Figure 8.2 provide the proportions and the number of EEs, respectively, falling within prespecifed ranges of values for the three reliability summary statistics (i.e., classification agreement rate, kappa, correlation). In general, the reliability summaries show strong evidence for reliability for the number of linkage levels mastered within EEs.
|
Index range
|
|||||||||
|---|---|---|---|---|---|---|---|---|---|
| Reliability Index | < .60 | 0.60-0.64 | 0.65-0.69 | 0.70-0.74 | 0.75-0.79 | 0.80-0.84 | 0.85-0.89 | 0.90-0.94 | 0.95-1.00 |
| Percent classification agreement | <.001 | <.001 | <.001 | .012 | .031 | .129 | .521 | .301 | .006 |
| Polychoric correlation | <.001 | .006 | <.001 | .006 | .025 | .043 | .129 | .374 | .417 |
| Cohen’s kappa | .012 | .012 | .012 | .006 | .031 | .098 | .202 | .497 | .129 |
Figure 8.2: Number of Linkage Levels Mastered Within EE Reliability Summaries.
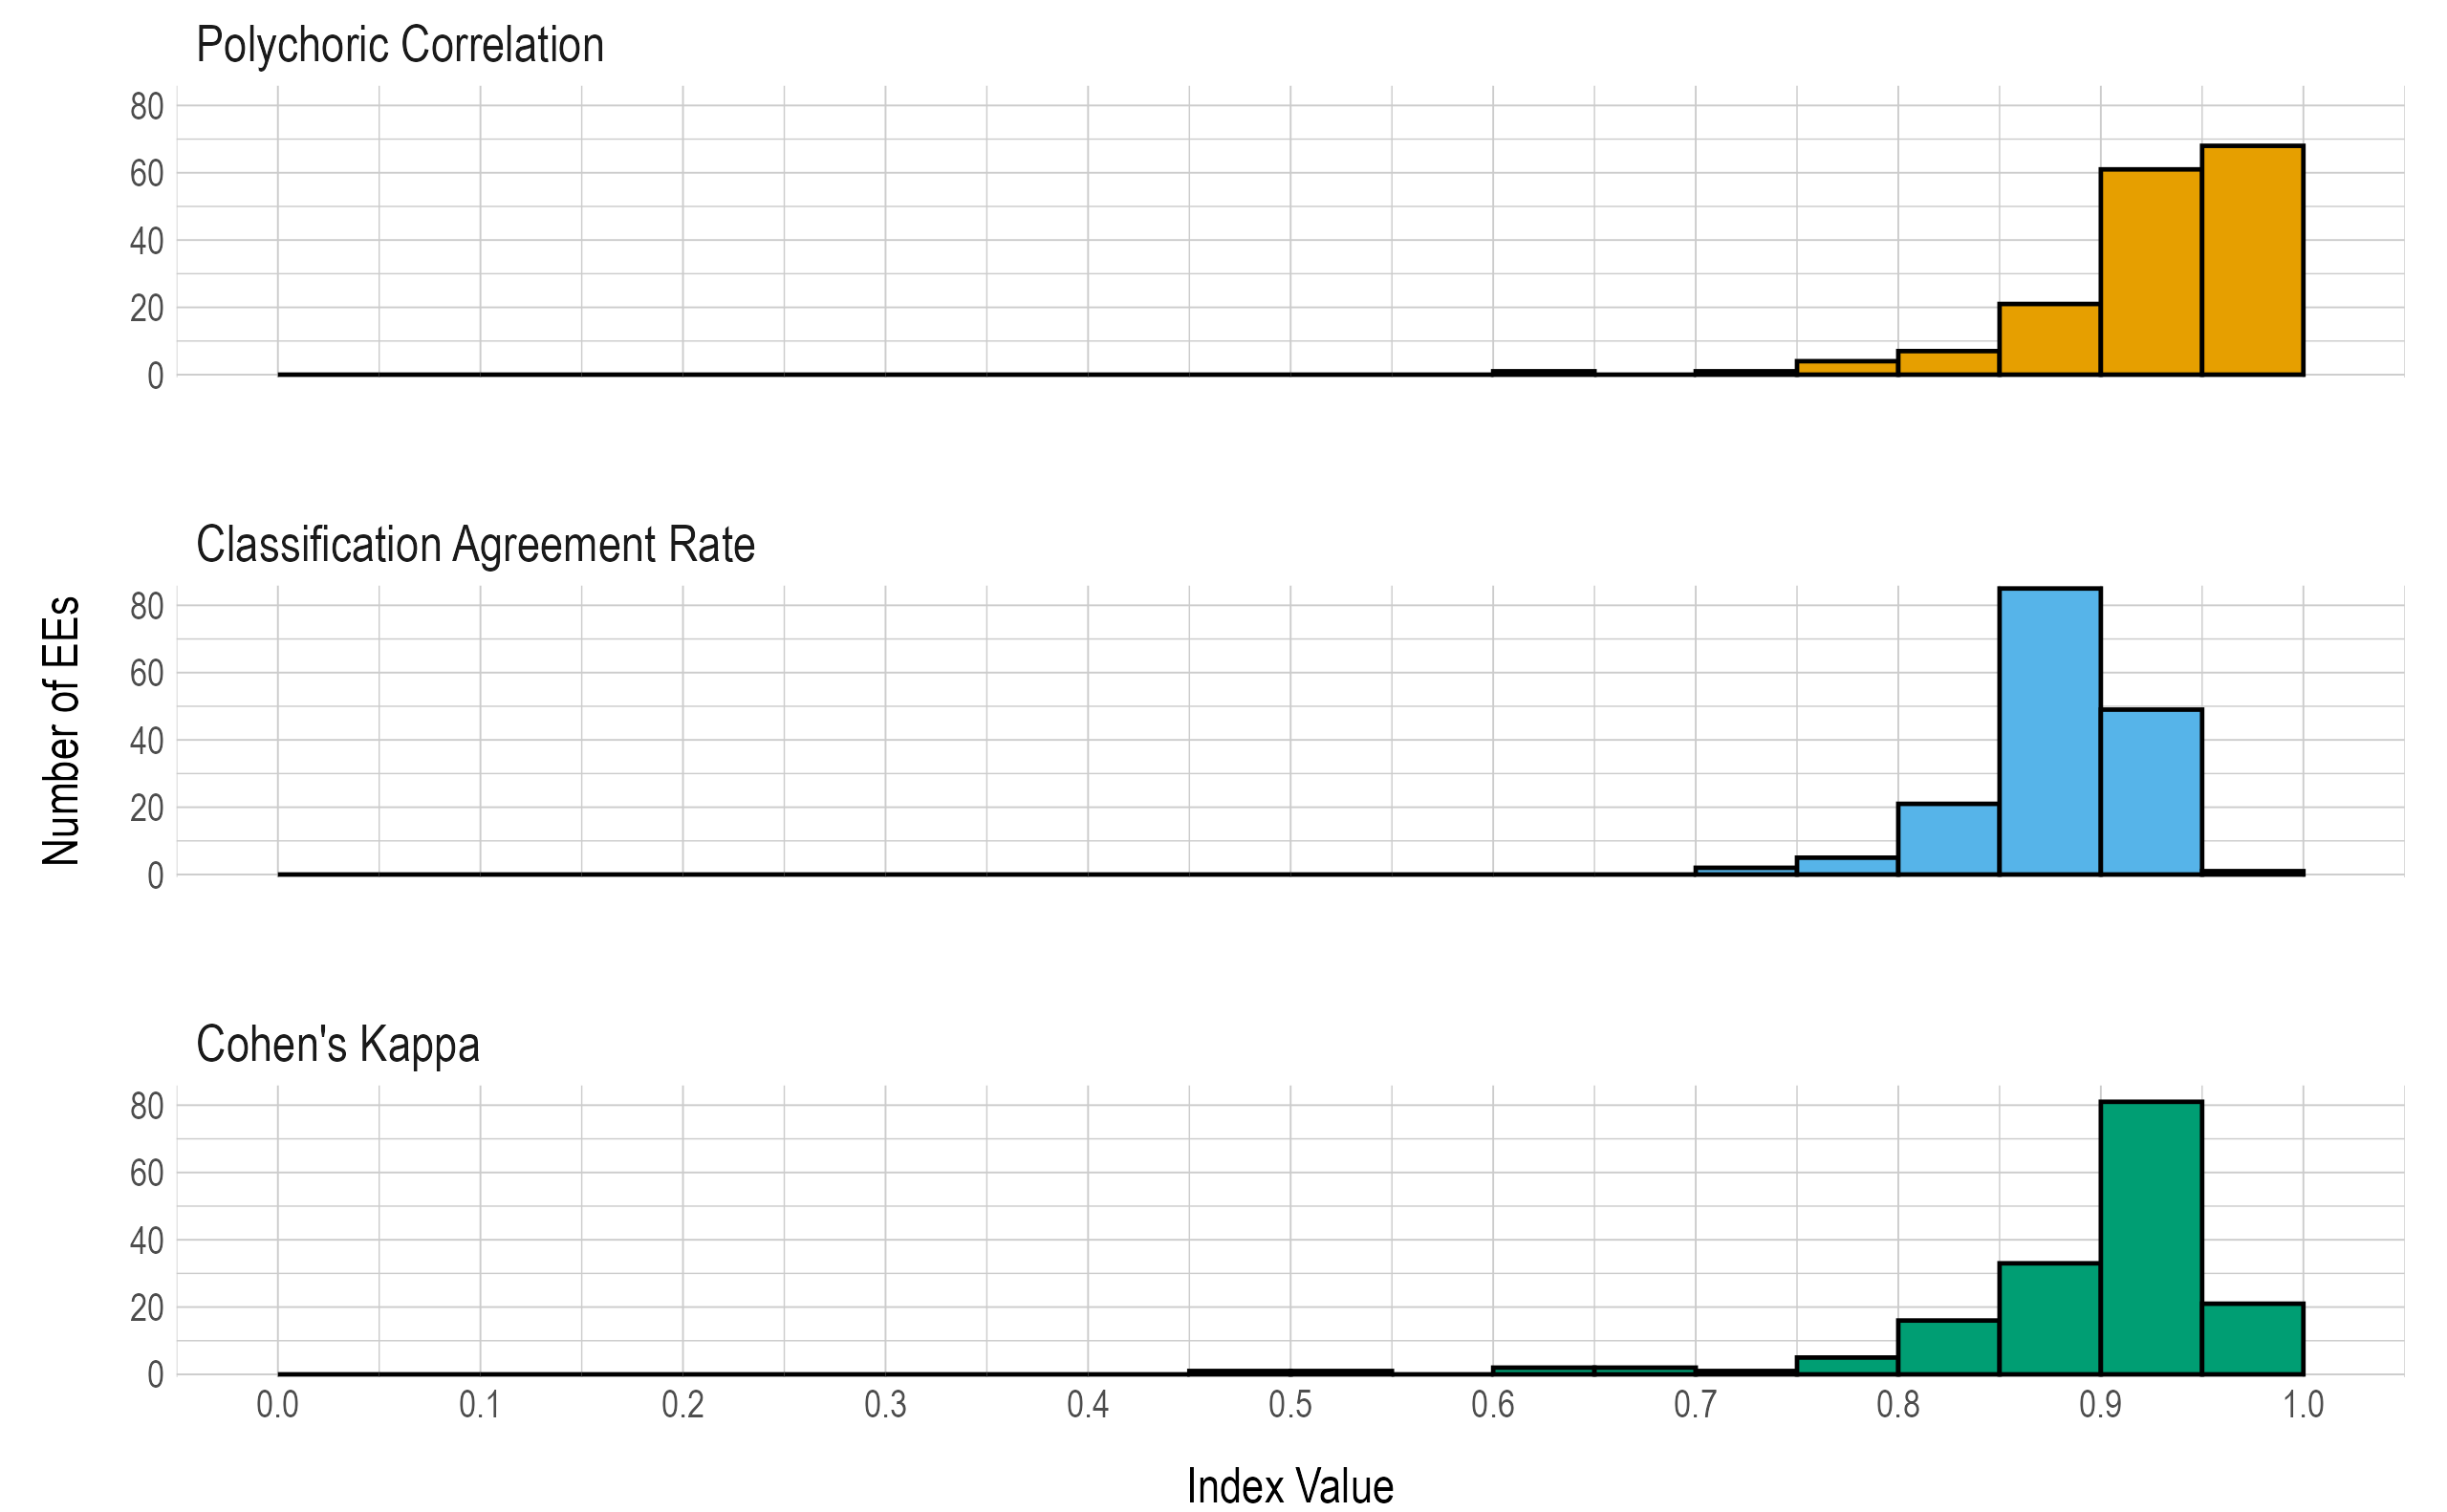
Table 8.5 provides the three reliability summary statistics for each EE.
8.3.5 Linkage Level Reliability Evidence
Evidence at the linkage level comes from comparing the true and estimated mastery status for each of the 815 linkage levels in the operational DLM assessment. The linkage level reliability evidence presented here focuses on consistency of measurement given student responses to items. For more information on how students were assigned linkage levels during assessment, see Chapter 3—Pilot Administration: Initialization and Chapter 4—Adaptive Delivery of the 2014–2015 Technical Manual—Year-End Model (Dynamic Learning Maps Consortium, 2016). This level of reliability reporting is even finer grained than the EE level. While it does not have a comparable classical test theory or item response theory analog, its inclusion is important because it is the level at which mastery classifications are made for DLM assessments. All reported summary statistics are based on the resulting contingency tables: the comparison of true and estimated mastery statuses across all simulated examinees. As with any contingency table, a number of summary statistics are possible.
For each statistic, figures are given comparing the results of all 815 linkage levels. Three summary statistics are presented:
- the tetrachoric correlation between estimated and true mastery status,
- the classification agreement for the mastery status of each linkage level, and
- the classification agreement Cohen’s kappa for the mastery status of each linkage level.
Results are given in both tabular and graphical forms. Table 8.6 and Figure 8.3 provide proportions and number of linkage levels, respectively, that fall within prespecified ranges of values for the three reliability summary statistics (i.e., classification agreement rate, kappa, correlation).
The correlations and classification agreement rates show reliability evidence for the classification of mastery at the linkage level. Across all linkage levels, 0 had a percent classification agreement below .6, 13 had a tetrachoric correlation below .6, and 66 had a Cohen’s kappa below .6. However, Cohen’s kappa may be limited in this context. Numerous studies have shown that the kappa statistic tends to be too conservative when there are unbalanced categories (Cicchetti & Feinstein, 1990; Feinstein & Cicchetti, 1990; O’Leary et al., 2014; Pontius & Millones, 2011). This can sometimes be the case for DLM linkage levels, where the base rate of linkage level mastery is often observed to be less than .3 or greater than .7. See Chapter 5 of this manual for a summary of base rates of linkage level mastery. Thus, it is important to interpret the kappa statistic with caution and within the context of the other reporting metrics.
|
Index range
|
|||||||||
|---|---|---|---|---|---|---|---|---|---|
| Reliability Index | < .60 | 0.60-0.64 | 0.65-0.69 | 0.70-0.74 | 0.75-0.79 | 0.80-0.84 | 0.85-0.89 | 0.90-0.94 | 0.95-1.00 |
| Percent classification agreement | <.001 | <.001 | <.001 | <.001 | <.001 | .004 | .043 | .299 | .654 |
| Tetrachoric correlation | .016 | .001 | <.001 | <.001 | .002 | .007 | .032 | .096 | .845 |
| Cohen’s kappa | .081 | .021 | .032 | .049 | .086 | .109 | .248 | .259 | .115 |
Figure 8.3: Summaries of Linkage Level Reliability.
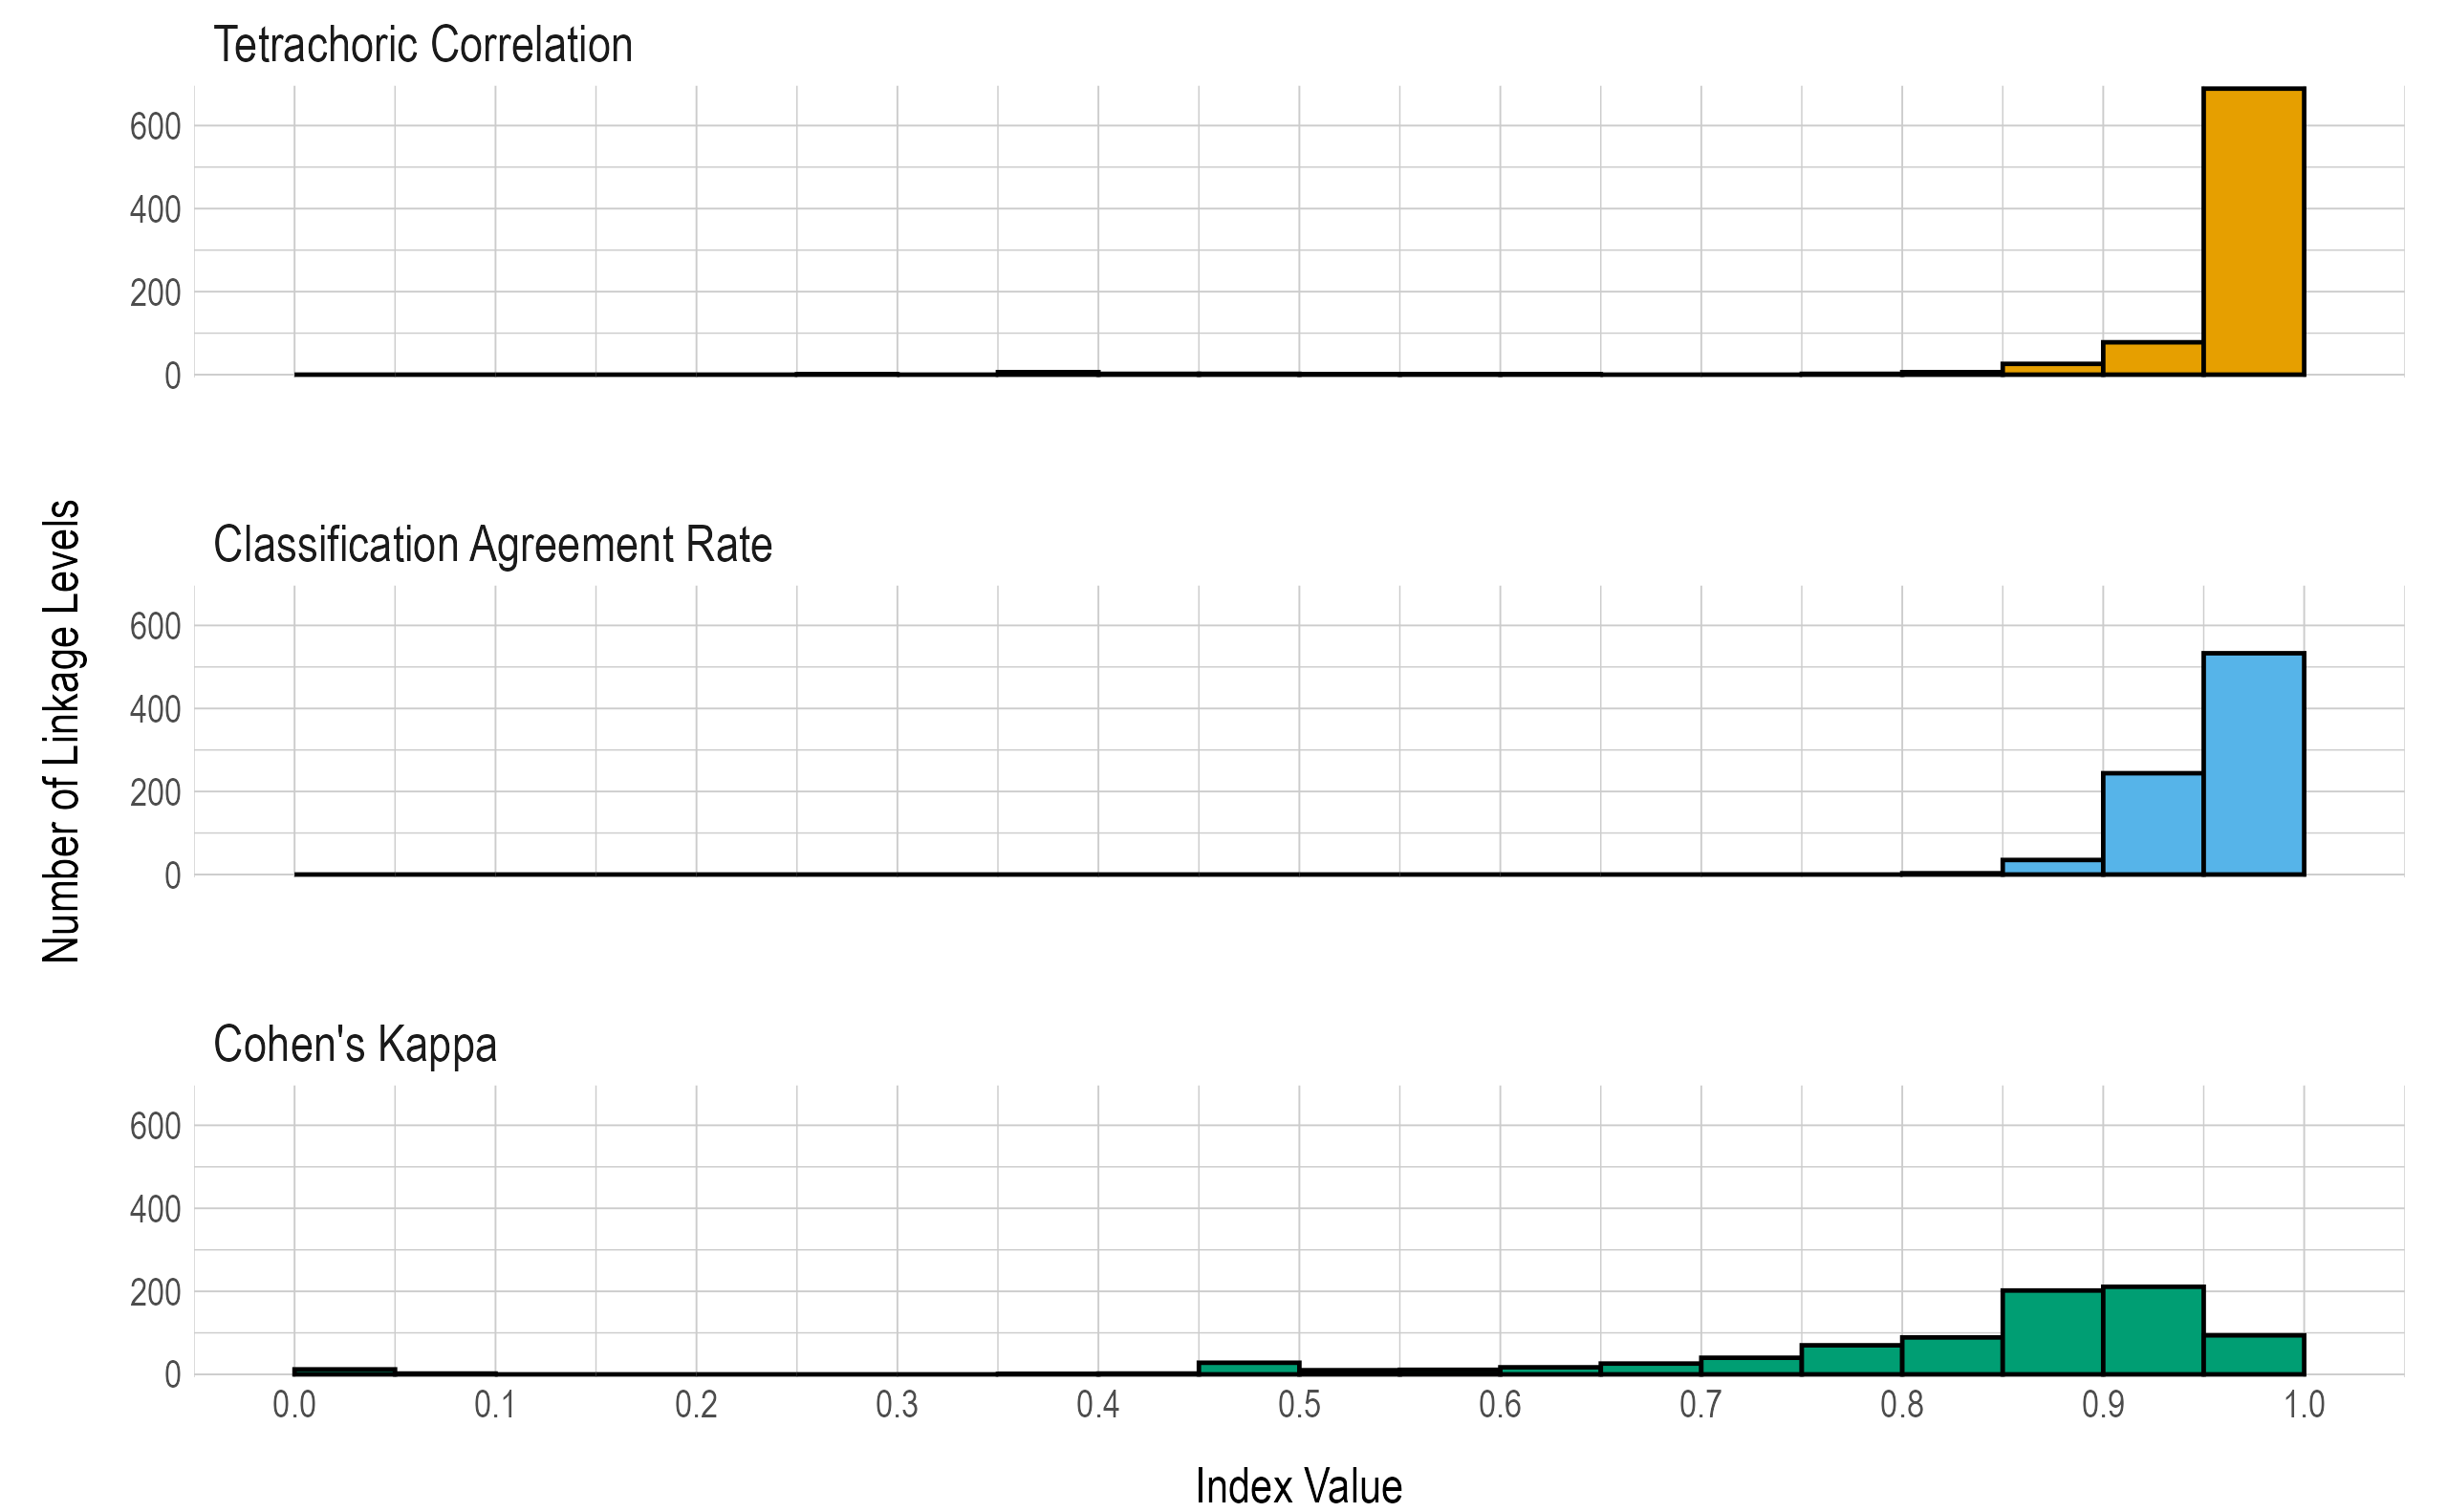
Table 8.7 provides the three reliability summary statistics for each linkage level.
8.3.6 Conditional Reliability Evidence by Linkage Level
Traditional assessment programs often report conditional standard errors of measurement to indicate how the precision of measurement differs along the score continuum. The DLM assessment system does not report total or scale-score values. However, because DLM assessments were designed to span the continuum of students’ varying skills and abilities as defined by the five linkage levels, evidence of reliability can be summarized for each linkage level to approximate conditional evidence over all EEs, similar to a conditional standard error of measurement for a total score.
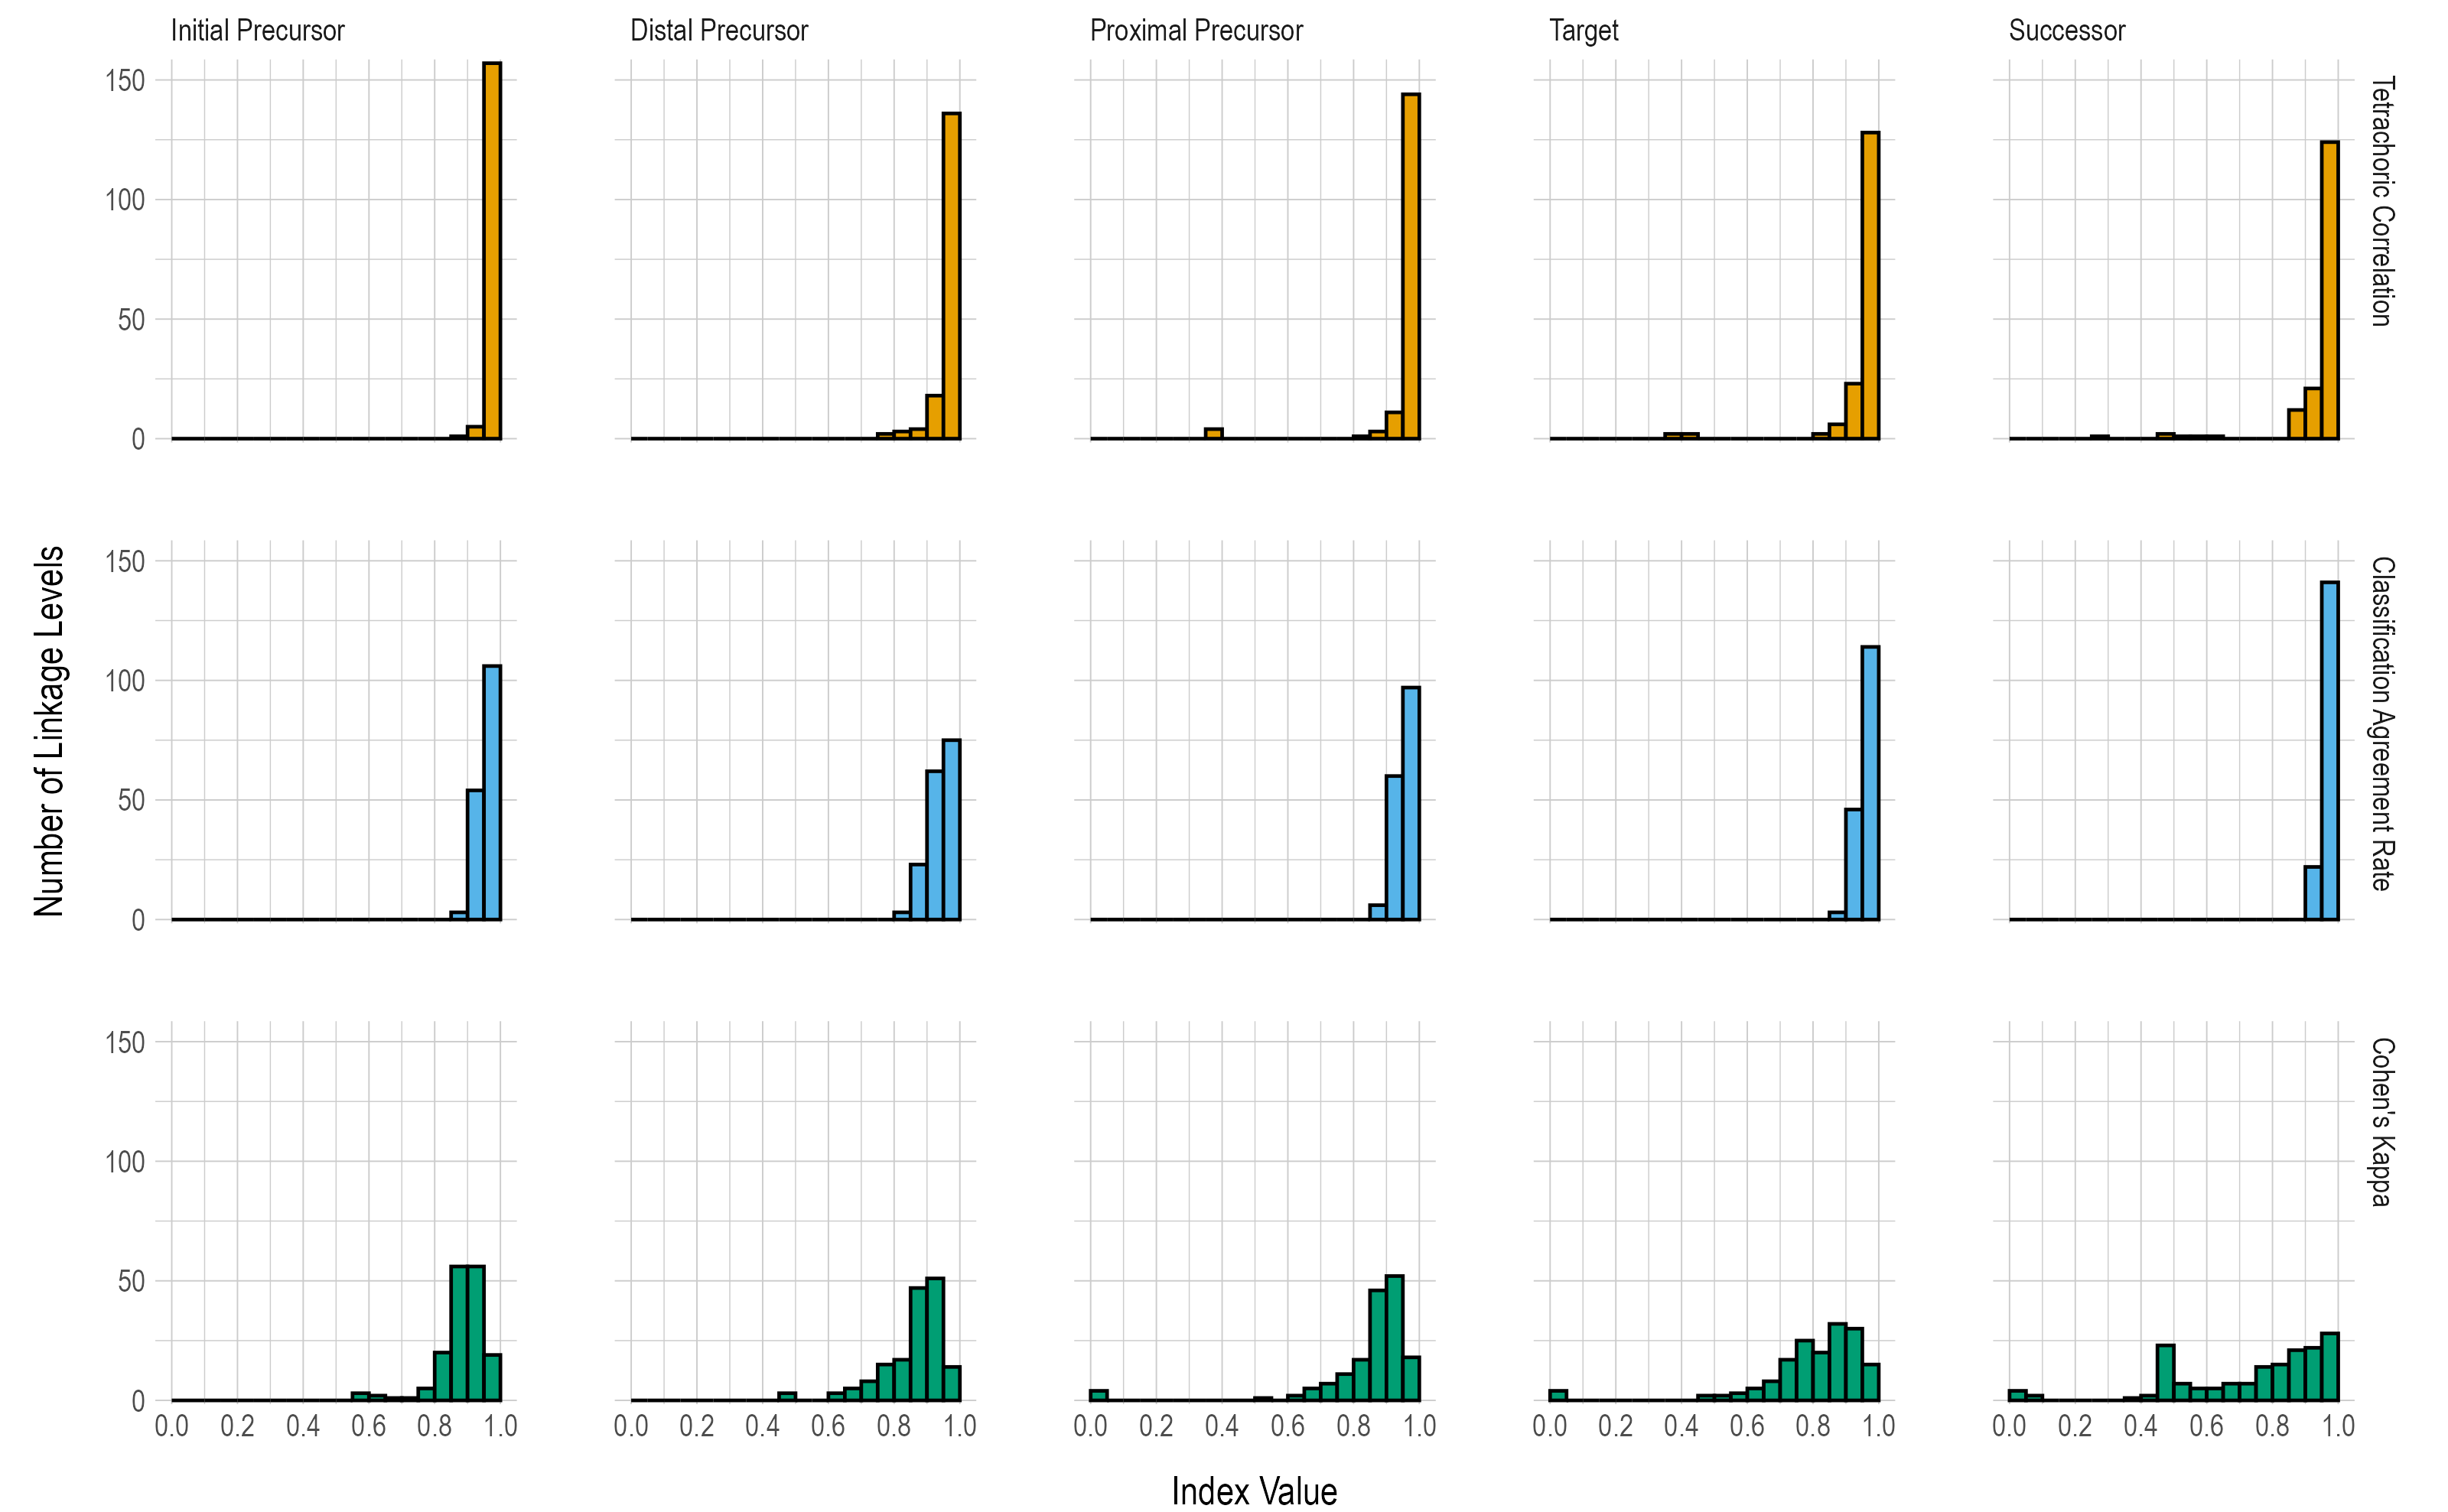
Conditional reliability evidence by linkage level is based on the true and estimated mastery statuses for each linkage level, summarized by each of the five levels. Results are reported using the same three statistics used for the overall linkage level reliability evidence (tetrachoric correlation, classification agreement rate, Cohen’s kappa).
Figure 8.4 provides the number of linkage levels that fall within prespecified ranges of values for the three reliability summary statistics (i.e., tetrachoric correlation, classification agreement rate, Cohen’s kappa). The correlations and classification agreement rates generally indicate that all five linkage levels provide reliable classifications of student mastery; results are fairly consistent across all linkage levels for each of the three statistics reported.
Figure 8.4: Conditional Reliability Evidence Summarized by Linkage Level
8.4 Conclusion
In summary, reliability measures for the DLM assessment system address the standards set forth by American Educational Research Association et al. (2014). The DLM methods are consistent with assumptions of diagnostic classification modeling and yield evidence to support the argument for internal consistency of the program for each level of reporting. Because the reliability results depend upon the model used to calibrate and score the assessment, any changes to the model or evidence obtained when evaluating model fit also affect reliability results. As with any selected methodology for evaluating reliability, the current results assume that the model and model parameters used to score DLM assessments are correct. However, unlike other traditional measures of reliability that often require unattainable assumptions about equivalent test forms, the simulation method described in this chapter provides a replication of the same test items (i.e., perfectly parallel forms), which theoretically reduces the amount of variance that may be found in test scores across administrations. Furthermore, while the reliability measures in general may be higher than those observed for some traditionally scored assessments, research has found that diagnostic classification models have greater reliability with fewer items (e.g., Templin & Bradshaw, 2013), suggesting the results are expected.