4 Test Administration
Chapter 4 of the Dynamic Learning Maps® (DLM®) Alternate Assessment System 2014–2015 Technical Manual—Year-End Model (Dynamic Learning Maps Consortium, 2016) describes general test administration and monitoring procedures. This chapter describes updated procedures and data collected in 2020–2021, including the DLM policy on virtual test administration, a summary of administration time, adaptive routing, Personal Needs and Preferences Profile selections, and teacher survey responses regarding user experience, remote assessment administration, and accessibility.
Overall, administration features remained consistent with the 2019–2020 intended implementation, including the availability of instructionally embedded testlets, spring operational administration of testlets, the use of adaptive delivery during the spring window, and the availability of accessibility supports.
For a complete description of test administration for DLM assessments, including information on available resources and materials and information on monitoring assessment administration, see the 2014–2015 Technical Manual—Year-End Model (Dynamic Learning Maps Consortium, 2016).
4.1 Overview of Key Administration Features
This section describes DLM test administration for 2020–2021. For a complete description of key administration features, including information on assessment delivery, Kite® Student Portal, and linkage level selection, see Chapter 4 of the 2014–2015 Technical Manual—Year-End Model (Dynamic Learning Maps Consortium, 2016). Additional information about changes in administration can also be found in the Test Administration Manual 2020–2021 (DLM Consortium, 2021) and the Educator Portal User Guide (Dynamic Learning Maps Consortium, 2021c).
4.1.1 Test Windows
Instructionally embedded assessments were available for teachers to optionally administer between September 14 and December 21, 2020, and between January 1 and February 24, 2021. During the consortium-wide spring testing window, which occurred between March 8 and July 2, 2021, students were assessed on each Essential Element (EE) on the blueprint. Each state education agency sets its own testing window within the larger consortium spring window.
4.1.2 DLM Statement on Virtual Assessment Administration
In October 2020, DLM staff released a policy document stating that DLM assessments must be administered in person by a qualified test administrator, not virtually (e.g., over Zoom, Microsoft Teams, Google Hangouts, etc., in which the test administrator is not physically present during administration). This policy was supported by a resolution from the DLM Technical Advisory Committee, who agreed that there would be too many risks associated with a virtual administration (e.g., student ability to access the content, test security, validity of score inferences). The policy does not require an in-school administration. For example, a test administrator could travel to the student’s house, or a separate off-site testing facility could be used.
4.2 Administration Evidence
This section describes evidence collected during the 2020–2021 operational administration of the DLM alternate assessment. The categories of evidence include data relating to administration time, device usage, and the adaptive delivery of testlets in the spring window.
4.2.1 Administration Time
Estimated administration time varies by student and subject. Total time during the instructionally embedded window varies depending on the number of Essential Elements (EEs) a teacher chooses and the number of times a student is assessed on each EE. Testlets can be administered separately across multiple testing sessions as long as they are all completed within the testing window. The estimated total testing time is 60–75 minutes per student in ELA and 35–50 minutes in mathematics.
The published estimated total testing time per testlet is around 5–10 minutes in mathematics, 10–15 minutes in reading, and 10-20 minutes for writing. Published estimates are slightly longer than anticipated real testing times because of the assumption that teachers need time for setup. Actual testing time per testlet varies depending on each student’s unique characteristics.
Kite Student Portal captured start and end dates and time stamps for every testlet. To calculate the actual testing time per testlet, the difference between these start and end times was calculated for each completed testlet. Table 4.1 summarizes the distribution of test times per testlet. Most testlets took around 6 minutes or less to complete, with mathematics testlets generally taking less time than ELA testlets. Testlets time out after 90 minutes.
| Grade | Min | Median | Mean | Max | 25Q | 75Q | IQR |
|---|---|---|---|---|---|---|---|
| English language arts | |||||||
| 3 | 0.13 | 4.12 | 5.09 | 88.73 | 2.73 | 6.18 | 3.45 |
| 4 | 0.20 | 4.35 | 5.37 | 89.82 | 2.92 | 6.57 | 3.65 |
| 5 | 0.10 | 4.33 | 5.29 | 89.95 | 2.88 | 6.55 | 3.67 |
| 6 | 0.17 | 4.27 | 5.20 | 89.42 | 2.90 | 6.35 | 3.45 |
| 7 | 0.10 | 5.18 | 6.27 | 88.25 | 3.37 | 7.73 | 4.37 |
| 8 | 0.13 | 4.42 | 5.33 | 87.83 | 3.00 | 6.55 | 3.55 |
| 9 | 0.22 | 4.78 | 5.95 | 88.17 | 3.00 | 7.32 | 4.32 |
| 10 | 0.20 | 4.72 | 5.80 | 88.90 | 3.07 | 7.13 | 4.07 |
| 11 | 0.12 | 5.13 | 6.45 | 89.95 | 3.27 | 7.88 | 4.62 |
| 12 | 0.27 | 5.28 | 6.48 | 72.93 | 3.32 | 7.92 | 4.60 |
| Mathematics | |||||||
| 3 | 0.12 | 1.97 | 2.81 | 89.75 | 1.15 | 3.40 | 2.25 |
| 4 | 0.07 | 1.53 | 2.22 | 88.00 | 0.97 | 2.53 | 1.57 |
| 5 | 0.08 | 1.68 | 2.39 | 85.10 | 1.03 | 2.78 | 1.75 |
| 6 | 0.08 | 1.77 | 2.49 | 88.63 | 1.13 | 2.92 | 1.78 |
| 7 | 0.03 | 1.72 | 2.42 | 84.68 | 1.03 | 2.90 | 1.87 |
| 8 | 0.08 | 1.67 | 2.32 | 87.75 | 1.03 | 2.77 | 1.73 |
| 9 | 0.08 | 1.77 | 2.51 | 81.38 | 0.98 | 3.05 | 2.07 |
| 10 | 0.07 | 1.67 | 2.35 | 81.37 | 1.02 | 2.78 | 1.77 |
| 11 | 0.07 | 1.83 | 2.60 | 73.78 | 1.13 | 3.12 | 1.98 |
| 12 | 0.13 | 1.75 | 2.62 | 87.50 | 1.07 | 3.07 | 2.00 |
| Note. Min = minimum, Max = maximum, 25Q = lower quartile, 75Q = upper quartile, IQR = interquartile range | |||||||
4.2.2 Device Usage
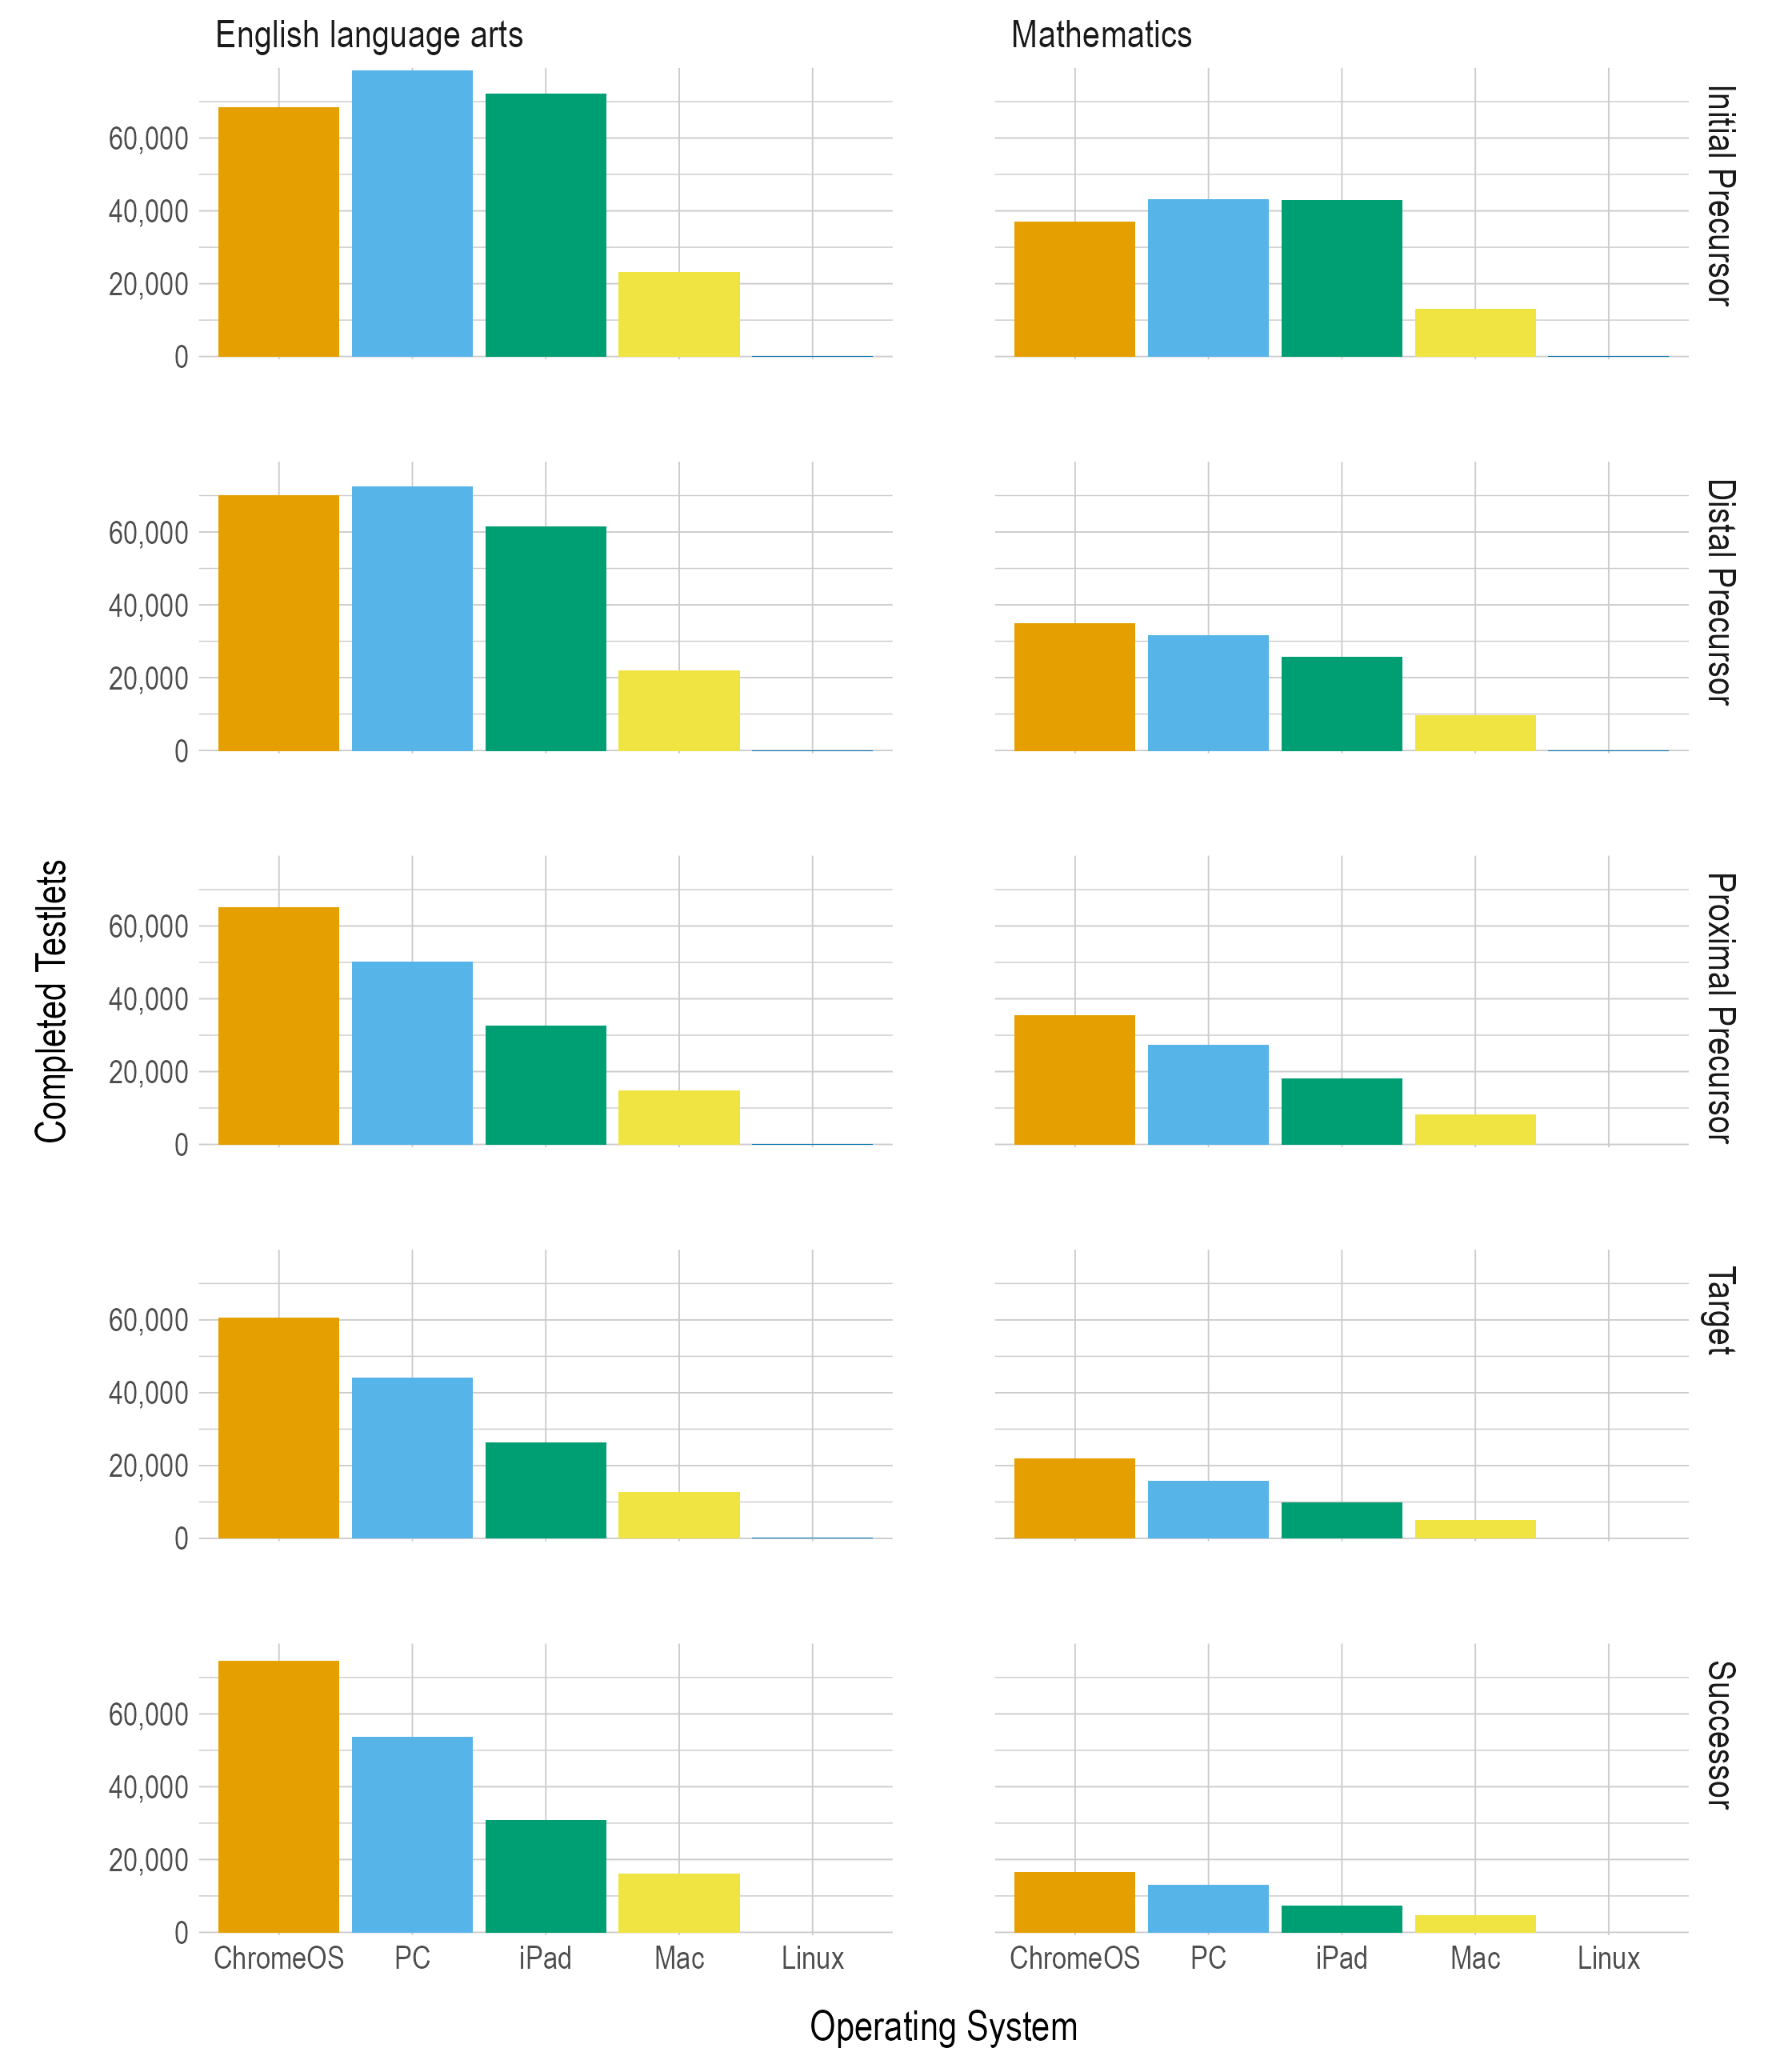
Testlets may be administered on a variety of platforms. In addition to start and end times, Kite Student Portal captured the operating system used for each testlet completed in 2020–2021. Although this data does not capture specific devices used to complete each testlet (e.g., SMART Board, switch system, etc.), this data does provide high-level information about how students access assessment content. For example, we can identify how often an iPad is used relative to a Chromebook or traditional PC. Figure 4.1 shows the number of testlets completed on each operating system, by subject and linkage level. Overall, 35% of testlets were completed on a Chromebook, 31% were completed on a PC, 24% were completed on an iPad, 9% were completed on a Mac, and < 1% were completed on a device running Linux. In general, PCs are the most popular operating system for lower linkage levels, whereas PCs and Chromebooks are more similar at the higher linkage levels. This may reflect that testlets at the lower linkage levels are typically teacher-administered, but higher linkage levels are computer administered. Thus, these results may indicate that teachers and students tend to use different devices for accessing assessment content.
Figure 4.1: Distribution of Devices Used for Completed Testlets
4.2.3 Adaptive Delivery
During the spring 2021 test administration, the ELA and mathematics assessments were adaptive between testlets, following the same routing rules applied in prior years. That is, the linkage level associated with the next testlet a student received was based on the student’s performance on the most recently administered testlet, with the specific goal of maximizing the match of student knowledge and skill to the appropriate linkage level content.
- The system adapted up one linkage level if the student responded correctly to at least 80% of the items measuring the previously tested EE. If the previous testlet was at the highest linkage level (i.e., Successor), the student remained at that level.
- The system adapted down one linkage level if the student responded correctly to less than 35% of the items measuring the previously tested EE. If the previous testlet was at the lowest linkage level (i.e., Initial Precursor), the student remained at that level.
- Testlets remained at the same linkage level if the student responded correctly to between 35% and 80% of the items on the previously tested EE.
The linkage level of the first testlet assigned to a student was based on First Contact survey responses. The correspondence between the First Contact complexity bands and first assigned linkage levels is shown in Table 4.2.
| First Contact complexity band | Linkage level |
|---|---|
| Foundational | Initial Precursor |
| Band 1 | Distal Precursor |
| Band 2 | Proximal Precursor |
| Band 3 | Target |
Following the spring 2021 administration, analyses were conducted to determine the mean percentage of testlets that adapted up a linkage level, stayed at the same linkage level, or adapted down a linkage level from the first to second testlet administered for students within a grade, subject, and complexity band. The aggregated results can be seen in Table 4.3 and Table 4.4 for ELA and mathematics, respectively.
For the majority of students across all grades who were assigned to the Foundational Complexity Band by the First Contact survey, testlets did not adapt to a higher linkage level after the first assigned testlet (ranging from 66.2% to 91.8% across both subjects). Consistent patterns were not as apparent for students who were assigned Complexity Band 1, Complexity Band 2, or Complexity Band 3. Distributions across the three categories were more variable across grades and subjects.
The 2020–2021 results build on earlier findings from the pilot study and the previous years of operational assessment administration (see Chapter 3 and Chapter 4 of the 2014–2015 Technical Manual—Year-End Model, respectively, as well as Chapter 3 and Chapter 4 of the annual technical manual updates). Results indicate that linkage levels of students assigned to higher complexity bands are more variable with respect to the direction in which students move between the first and second testlets. Several factors may help explain these results, including more variability in student characteristics within this group and content-based differences across grades and subjects. Further exploration is needed in this area.
| Grade | Adapted up (%) | Did not adapt (%) | Adapted up (%) | Did not adapt (%) | Adapted down (%) | Adapted up (%) | Did not adapt (%) | Adapted down (%) | Adapted up (%) | Did not adapt (%) | Adapted down (%) |
|---|---|---|---|---|---|---|---|---|---|---|---|
| Grade 3 | 12.0 | 88.0 | 60.8 | 22.0 | 17.2 | 79.2 | 14.4 | 6.4 | 92.6 | 3.7 | 3.7 |
| Grade 4 | 27.7 | 72.3 | 17.0 | 30.6 | 52.5 | 62.9 | 25.6 | 11.5 | 48.1 | 18.6 | 33.3 |
| Grade 5 | 27.2 | 72.8 | 24.4 | 29.4 | 46.2 | 60.6 | 33.4 | 6.0 | 91.2 | 5.9 | 2.9 |
| Grade 6 | 30.6 | 69.4 | 12.5 | 21.4 | 66.1 | 24.6 | 40.0 | 35.4 | 38.6 | 44.2 | 17.3 |
| Grade 7 | 32.7 | 67.3 | 29.0 | 25.5 | 45.6 | 51.3 | 35.4 | 13.3 | 69.0 | 25.6 | 5.4 |
| Grade 8 | 33.8 | 66.2 | 30.1 | 22.9 | 47.0 | 67.8 | 22.0 | 10.2 | 88.4 | 8.5 | 3.1 |
| Grade 9 | 13.1 | 86.9 | 33.3 | 32.0 | 34.8 | 22.6 | 30.6 | 46.8 | 67.8 | 23.3 | 8.8 |
| Grade 10 | 8.2 | 91.8 | 29.4 | 39.1 | 31.4 | 13.5 | 31.5 | 55.0 | 69.4 | 24.2 | 6.4 |
| Grade 11 | 26.4 | 73.6 | 10.5 | 39.5 | 50.0 | 63.9 | 23.6 | 12.6 | 67.7 | 21.6 | 10.6 |
| Note. Foundational is the lowest complexity band, so testlets could not adapt down a linkage level. |
| Grade | Adapted up (%) | Did not adapt (%) | Adapted up (%) | Did not adapt (%) | Adapted down (%) | Adapted up (%) | Did not adapt (%) | Adapted down (%) | Adapted up (%) | Did not adapt (%) | Adapted down (%) |
|---|---|---|---|---|---|---|---|---|---|---|---|
| Grade 3 | 10.4 | 89.6 | 11.5 | 30.8 | 57.7 | 18.4 | 54.5 | 27.1 | 77.8 | 15.6 | 6.7 |
| Grade 4 | 13.8 | 86.2 | 18.5 | 32.7 | 48.8 | 64.3 | 27.9 | 7.8 | 74.1 | 20.6 | 5.3 |
| Grade 5 | 18.1 | 81.9 | 12.6 | 31.0 | 56.4 | 40.7 | 25.9 | 33.4 | 60.5 | 26.9 | 12.6 |
| Grade 6 | 16.2 | 83.8 | 14.1 | 44.9 | 41.0 | 29.4 | 36.8 | 33.8 | 50.4 | 42.6 | 7.0 |
| Grade 7 | 15.2 | 84.8 | 13.3 | 26.6 | 60.1 | 19.4 | 19.9 | 60.7 | 74.2 | 17.4 | 8.4 |
| Grade 8 | 13.9 | 86.1 | 15.8 | 49.1 | 35.0 | 29.7 | 55.3 | 15.1 | 50.0 | 24.4 | 25.6 |
| Grade 9 | 15.4 | 84.6 | 22.3 | 49.2 | 28.5 | 54.7 | 39.0 | 6.3 | 61.9 | 32.2 | 5.9 |
| Grade 10 | 16.2 | 83.8 | 29.6 | 29.3 | 41.1 | 29.9 | 19.4 | 50.7 | 4.8 | 31.0 | 64.2 |
| Grade 11 | 23.7 | 76.3 | 11.0 | 25.4 | 63.7 | 26.3 | 35.4 | 38.3 | 17.1 | 13.1 | 69.8 |
| Note. Foundational is the lowest complexity band, so testlets could not adapt down a linkage level. |
4.2.4 Administration Incidents
As in all previous years, testlet assignment during the spring 2021 assessment window was monitored for evidence that students were correctly assigned to testlets. Administration incidents that have the potential to affect scoring are reported to state education agencies in a supplemental Incident File. No incidents were observed during the spring 2021 assessment window. Assignment of testlets will continue to be monitored in subsequent years to track any potential incidents and report them to state education agencies.
4.3 Implementation Evidence
This section describes evidence collected during the spring 2021 operational implementation of the DLM alternate assessment. The categories of evidence include a description of Kite system updates and survey data relating to user experience, remote assessment administration, and accessibility.
4.3.1 Kite System Updates
Several updates were made to the Kite system during 2020–2021 to improve its functionality. Text was added to the Instruction and Assessment Planner to explain that the EEs for high school mathematics for non-enrolled grades are optional and do not count towards blueprint requirements. A new Student Roster and First Contact Survey Status extract was created to provide testing readiness information in one place. The roster includes the current grade in which the student is enrolled, all subjects in which the student is rostered, and the student’s First Contact survey status and completion date. A majority of the pages in Educator Portal that include tables were reorganized to take advantage of the horizontal space. All tables in Educator Portal were updated to a standard user interface. An update was made to the user interface by having users first enter roster information; roster name and subject, as well as roster location; state, district, and school. Lastly, the voice generator used to create the spoken audio for text to speech on all testlets was updated to a more lifelike voice at a standard reading speed.
4.3.2 User Experience With the DLM System
User experience with the spring 2021 assessments was evaluated through the spring 2021 survey, which was disseminated to all teachers who had a student rostered for DLM assessments. As in previous years, the survey was distributed to teachers in Kite Student Portal, where students completed assessments. Each student was assigned a survey for their teacher to complete. The survey consisted of four blocks. Blocks A and C, which provide information used for the validity argument and information about teacher background, respectively, are administered in every survey. Block B is spiraled, and teachers are asked about one of the following topics per survey: accessibility, relationship to ELA instruction, relationship to mathematics instruction, or relationship to science instruction. Block N was added in 2021 to gather information about educational context during the COVID-19 pandemic.
A total of 12,040 teachers responded to the survey (with a response rate of 63%) about 33,497 students’ experiences.
Participating teachers responded to surveys for a median of 2 students. Teachers reported having an average of 11 years of experience in ELA, 11 years in mathematics, and 10 years with students with significant cognitive disabilities. The median response to the number of years of experience in ELA was 10 years, the median experience in mathematics was 9 years, and the median experience with students with significant cognitive disabilities was 7 years. Approximately 19% indicated they had experience administering the DLM assessment in all seven operational years.
The following sections summarize user experience with the system, remote assessment administration, and accessibility. Additional survey results are summarized in Chapter 9 (Validity Studies). Survey results pertaining to the educational experience of students during the COVID-19 pandemic are described by Accessible Teaching, Learning, and Assessment, Systems (Accessible Teaching, Learning, and Assessment Systems, 2021). For responses to the priors years’ surveys, see Chapter 4 and Chapter 9 in the respective technical manuals (Dynamic Learning Maps Consortium, 2018, 2019, 2020).
4.3.2.1 Educator Experience
Survey respondents were asked to reflect on their own experience with the assessments as well as their comfort level and knowledge administering them. Most of the questions required teachers to respond on a 4-point scale: strongly disagree, disagree, agree, or strongly agree. Responses are summarized in Table 4.5.
Nearly all teachers (94%) agreed or strongly agreed that they were confident administering DLM testlets. Most respondents (85%) agreed or strongly agreed that the required test administrator training prepared them for their responsibilities as test administrators. Most teachers also responded that they had access to curriculum aligned with the content that was measured by the assessments (86%) and that they used the manuals and the Educator Resources page (89%).
| Statement | n | % | n | % | n | % | n | % | n | % |
|---|---|---|---|---|---|---|---|---|---|---|
| I was confident in my ability to deliver DLM testlets | 200 | 1.8 | 494 | 4.5 | 4,613 | 42.1 | 5,653 | 51.6 | 10,266 | 93.7 |
| Required test administrator training prepared me for the responsibilities of a test administrator | 458 | 4.2 | 1,143 | 10.4 | 5,425 | 49.6 | 3,912 | 35.8 | 9,337 | 85.4 |
| I have access to curriculum aligned with the content measured by DLM assessments | 368 | 3.4 | 1,127 | 10.3 | 5,788 | 53.0 | 3,635 | 33.3 | 9,423 | 86.3 |
| I used manuals and/or the DLM Educator Resource Page materials | 275 | 2.5 | 923 | 8.4 | 6,085 | 55.6 | 3,659 | 33.4 | 9,744 | 89.0 |
| Note. SD = strongly disagree; D = disagree; A = agree; SA = strongly agree; A+SA = agree and strongly agree. |
4.3.3 Remote Assessment Administration
Two questions on Block N of the survey asked test administrators where their student took assessments this year, and if the student took any tests remotely (i.e., at a location other than school but with a trained test administrator present), what their remote testing experience was like. As a reminder, the DLM policy on virtual assessment administration required an in-person test administrator, but that administration was not required to occur in school. Table 4.6 summarizes teacher responses regarding the setting of test administration. Most teachers (95%) responded that DLM assessments were administered to the student at school. Table 4.7 summarizes teachers’ responses about the experience of students who took DLM assessments remotely. Of the students who took assessments remotely, very few (less than 24%, 3% of all students) used different accessibility supports than they would normally have access to, experienced technology difficulties, had to respond in a less preferred response mode, and/or had someone other than the teacher administer the assessments remotely (e.g., paraeducator or other qualified test administrator).
| Setting | n | % |
|---|---|---|
| At school | 30,712 | 95.0 |
| At home | 543 | 1.7 |
| Testing facility not at school | 174 | 0.5 |
| Other | 153 | 0.5 |
| Not applicable | 745 | 2.3 |
| Circumstance | Yes (%) | No (%) | Unknown (%) |
|---|---|---|---|
| Student used different accessibility supports when testing remotely than at school | 1,032 (17.8) | 4,134 (71.3) | 634 (10.9) |
| Student experienced technology difficulties during assessments taken remotely | 671 (10.6) | 5,162 (81.5) | 502 (7.9) |
| Student had to respond in a less preferred response mode because of remote arrangements | 645 (10.6) | 4,925 (81.0) | 510 (8.4) |
| Someone other than the teacher administered the assessments remotely | 342 (5.3) | 5,757 (88.4) | 411 (6.3) |
4.3.4 Accessibility
Accessibility supports provided in 2020–2021 were the same as those available in previous years. The DLM Accessibility Manual (Dynamic Learning Maps Consortium, 2021b), distinguishes accessibility supports that are provided in Kite Student Portal via the Personal Needs and Preferences Profile, require additional tools or materials, or are provided by the test administrator outside the system.
Table 4.8 shows selection rates for the three categories of accessibility supports. The most commonly selected supports were human read aloud, test administrator enters responses for student, and individualized manipulatives. For a complete description of the available accessibility supports, see Chapter 4 of the 2014–2015 Technical Manual—Year-End Model (Dynamic Learning Maps Consortium, 2016).
| Support | n | % |
|---|---|---|
| Supports provided in Kite Student Portal | ||
| Spoken audio | 14,217 | 21.2 |
| Magnification | 8,825 | 13.1 |
| Color contrast | 5,680 | 8.5 |
| Overlay color | 2,854 | 4.3 |
| Invert color choice | 1,833 | 2.7 |
| Supports requiring additional tools/materials | ||
| Individualized manipulatives | 32,235 | 48.0 |
| Calculator | 21,059 | 31.4 |
| Single-switch system | 2,380 | 3.5 |
| Alternate form - visual impairment | 1,517 | 2.3 |
| Two-switch system | 780 | 1.2 |
| Uncontracted braille | 40 | 0.1 |
| Supports provided outside the system | ||
| Human read aloud | 59,517 | 88.6 |
| Test administrator enters responses for student | 40,362 | 60.1 |
| Partner assisted scanning | 6,367 | 9.5 |
| Language translation of text | 1,189 | 1.8 |
| Sign interpretation of text | 980 | 1.5 |
Teachers were asked whether the student was able to effectively use available accessibility supports and whether the accessibility supports were similar to the ones used for instruction. The majority of teachers agreed that students were able to effectively use accessibility supports (93%).
Of the teachers who reported that their student was unable to effectively use the accessibility supports (7%), the most commonly reported reason was that the student could not provide a response even with the support provided (55%). These data are shown in Table 4.9.
| Reason | n | % |
|---|---|---|
| Even with support, the student could not provide a response | 597 | 55.1 |
| The student needed a support that wasn’t available or allowed | 260 | 24.0 |
| The student was unfamiliar with the support | 168 | 15.5 |
| The student refused the support during testing | 137 | 12.7 |
| There was a technology problem (e.g., KITE display, AAC device) | 49 | 4.5 |
4.3.5 Data Forensics Monitoring
During the spring 2021 administration, two data forensics monitoring reports were made available in Educator Portal. The first report includes information about testlets completed outside of normal business hours. The second report includes information about testlets that were completed within a short period of time.
The Testing Outside of Hours report allows state education agencies to specify days and hours within a day that testlets are expected to be completed. Each state can select its own days and hours for setting expectations. For example, a state could elect to flag any testlet completed outside of Monday through Friday from 6:00 a.m. to 5:00 p.m. local time. The Testing Outside of Hours report then identifies students who completed assessments outside of the defined expected hours. Overall, 7,017 (1%) English language arts and mathematics testlets were completed outside of the expected hours by 5,024 (9%) students.
The Testing Completed in a Short Period of Time report identifies students who completed a testlet within an unexpectedly short period of time. The threshold for inclusion in the report was testlet completion time of less than 30 seconds in mathematics and 60 seconds in ELA. The report is intended for state users to identify potentially aberrant response patterns; however there are many legitimate reasons a testlet may be submitted in a short time period. Overall, 19,845 (2%) testlets were completed in an short period of time by 7,237 (13%) students.
4.4 Conclusion
During the spring 2021 administration, the DLM system was available during two testing windows: an optional instructionally embedded window and the spring window. Administration evidence was collected in the form of administration time data and adaptive delivery results. Implementation evidence was collected in the form of teacher survey responses regarding user experience, remote assessment administration, accessibility, and Personal Needs and Profile selections. New data forensics monitoring reports were made available to state education agencies in Educator Portal.